

FRENCH WOODLAND PRICES
Sales in your
department.
Choose a department to explore forest sales retained from DVF. These statistics describe a transaction sample; they do not establish the value of every forest.
Nièvre (58) · DVF 2025
80% of prices in this sample fall between 1,315 and 16,550 €/ha. These are the 10th and 90th sale percentiles, not a valuation range for the property.
WoodWorth calculations · DGFiP / Etalab 2025 DVF · Files dated 18 May 2026 · Accessed 28 September 2026. Exclusively forest sales with no declared building, 1–1,000 ha, €500–100,000/ha, at least 5 sales. Full methodology ↗
View all departments
| Department | Sales | Mean €/ha | Median €/ha |
|---|---|---|---|
| 01 · Ain | 69 | 3,821 | 2,714 |
| 02 · Aisne | 110 | 7,095 | 6,000 |
| 03 · Allier | 54 | 5,378 | 2,989 |
| 04 · Alpes-de-Haute-Provence | 28 | 2,446 | 1,197 |
| 05 · Hautes-Alpes | 5 | 21,154 | 5,073 |
| 06 · Alpes-Maritimes | 30 | 15,094 | 6,900 |
| 07 · Ardèche | 77 | 3,354 | 2,397 |
| 08 · Ardennes | 57 | 7,592 | 5,432 |
| 09 · Ariège | 16 | 2,272 | 1,635 |
| 10 · Aube | 65 | 7,035 | 4,757 |
| 11 · Aude | 22 | 2,538 | 1,943 |
| 12 · Aveyron | 37 | 2,396 | 1,665 |
| 13 · Bouches-du-Rhône | 20 | 9,717 | 4,387 |
| 14 · Calvados | 34 | 9,206 | 8,312 |
| 15 · Cantal | 72 | 3,604 | 2,040 |
| 16 · Charente | 87 | 2,582 | 1,788 |
| 17 · Charente-Maritime | 78 | 2,408 | 2,003 |
| 18 · Cher | 39 | 7,227 | 5,000 |
| 19 · Corrèze | 162 | 3,606 | 1,581 |
| 21 · Côte-d'Or | 56 | 6,786 | 3,593 |
| 22 · Côtes-d'Armor | 50 | 6,296 | 4,834 |
| 23 · Creuse | 88 | 3,365 | 1,682 |
| 24 · Dordogne | 263 | 2,543 | 1,852 |
| 25 · Doubs | 130 | 6,598 | 5,224 |
| 26 · Drôme | 61 | 2,424 | 1,755 |
| 27 · Eure | 92 | 9,782 | 9,200 |
| 28 · Eure-et-Loir | 38 | 7,538 | 6,147 |
| 29 · Finistère | 30 | 5,213 | 4,000 |
| 2A · Corse-du-Sud | 24 | 8,895 | 6,662 |
| 2B · Haute-Corse | 16 | 3,320 | 2,382 |
| 30 · Gard | 56 | 5,913 | 2,120 |
| 31 · Haute-Garonne | 34 | 4,305 | 3,109 |
| 32 · Gers | 60 | 4,299 | 3,053 |
| 33 · Gironde | 264 | 5,941 | 3,502 |
| 34 · Hérault | 18 | 7,116 | 1,649 |
| 35 · Ille-et-Vilaine | 25 | 7,177 | 5,872 |
| 36 · Indre | 45 | 4,973 | 3,466 |
| 37 · Indre-et-Loire | 108 | 3,864 | 3,073 |
| 38 · Isère | 88 | 3,434 | 2,245 |
| 39 · Jura | 82 | 3,903 | 3,053 |
| 40 · Landes | 166 | 5,985 | 4,982 |
| 41 · Loir-et-Cher | 76 | 5,684 | 4,737 |
| 42 · Loire | 128 | 4,787 | 3,385 |
| 43 · Haute-Loire | 146 | 3,593 | 2,463 |
| 44 · Loire-Atlantique | 21 | 4,691 | 2,601 |
| 45 · Loiret | 64 | 7,066 | 6,038 |
| 46 · Lot | 80 | 2,976 | 2,092 |
| 47 · Lot-et-Garonne | 89 | 4,696 | 4,202 |
| 48 · Lozère | 17 | 3,174 | 2,488 |
| 49 · Maine-et-Loire | 98 | 4,103 | 3,187 |
| 50 · Manche | 15 | 7,098 | 6,000 |
| 51 · Marne | 102 | 6,326 | 5,275 |
| 52 · Haute-Marne | 98 | 4,246 | 2,961 |
| 53 · Mayenne | 9 | 6,117 | 5,000 |
| 54 · Meurthe-et-Moselle | 54 | 4,774 | 3,509 |
| 55 · Meuse | 76 | 5,010 | 4,314 |
| 56 · Morbihan | 61 | 4,697 | 4,027 |
| 58 · Nièvre | 112 | 6,795 | 3,721 |
| 59 · Nord | 23 | 19,662 | 16,408 |
| 60 · Oise | 78 | 10,773 | 7,933 |
| 61 · Orne | 49 | 11,888 | 10,000 |
| 62 · Pas-de-Calais | 35 | 24,297 | 23,249 |
| 63 · Puy-de-Dôme | 238 | 3,364 | 1,908 |
| 64 · Pyrénées-Atlantiques | 39 | 3,355 | 2,325 |
| 65 · Hautes-Pyrénées | 19 | 2,242 | 1,810 |
| 66 · Pyrénées-Orientales | 10 | 9,552 | 3,824 |
| 69 · Rhône | 105 | 6,248 | 3,949 |
| 70 · Haute-Saône | 103 | 3,861 | 2,728 |
| 71 · Saône-et-Loire | 133 | 6,255 | 3,465 |
| 72 · Sarthe | 142 | 4,897 | 4,438 |
| 73 · Savoie | 21 | 3,255 | 2,538 |
| 74 · Haute-Savoie | 30 | 4,813 | 2,989 |
| 75 · Paris | 0 | — | — |
| 76 · Seine-Maritime | 39 | 14,803 | 14,404 |
| 77 · Seine-et-Marne | 63 | 6,157 | 4,987 |
| 78 · Yvelines | 14 | 6,716 | 5,814 |
| 79 · Deux-Sèvres | 48 | 2,680 | 1,972 |
| 80 · Somme | 29 | 18,250 | 17,335 |
| 81 · Tarn | 55 | 3,890 | 2,564 |
| 82 · Tarn-et-Garonne | 26 | 5,350 | 3,889 |
| 83 · Var | 131 | 9,058 | 4,230 |
| 84 · Vaucluse | 36 | 7,076 | 3,444 |
| 85 · Vendée | 29 | 5,760 | 4,711 |
| 86 · Vienne | 69 | 3,439 | 2,836 |
| 87 · Haute-Vienne | 74 | 2,618 | 1,948 |
| 88 · Vosges | 121 | 5,701 | 3,250 |
| 89 · Yonne | 103 | 7,175 | 4,002 |
| 90 · Territoire de Belfort | 12 | 4,705 | 4,254 |
| 91 · Essonne | 14 | 11,467 | 4,894 |
| 92 · Hauts-de-Seine | 0 | — | — |
| 93 · Seine-Saint-Denis | 0 | — | — |
| 94 · Val-de-Marne | 0 | — | — |
| 95 · Val-d'Oise | 7 | 10,219 | 7,056 |
National and regional benchmarks
The 2026 Safer release reports €2,850/ha for the Massif central and €7,880/ha for the Nord-Bassin parisien. Its benchmark for forests of 10–25 hectares is €4,330/ha. These statistical groups are not interchangeable.
Reading a regional price
Regional averages mix different properties. At department level, a small or unusual set of sales can distort a benchmark. Check the period, property size, buildings and methodology before comparing figures.
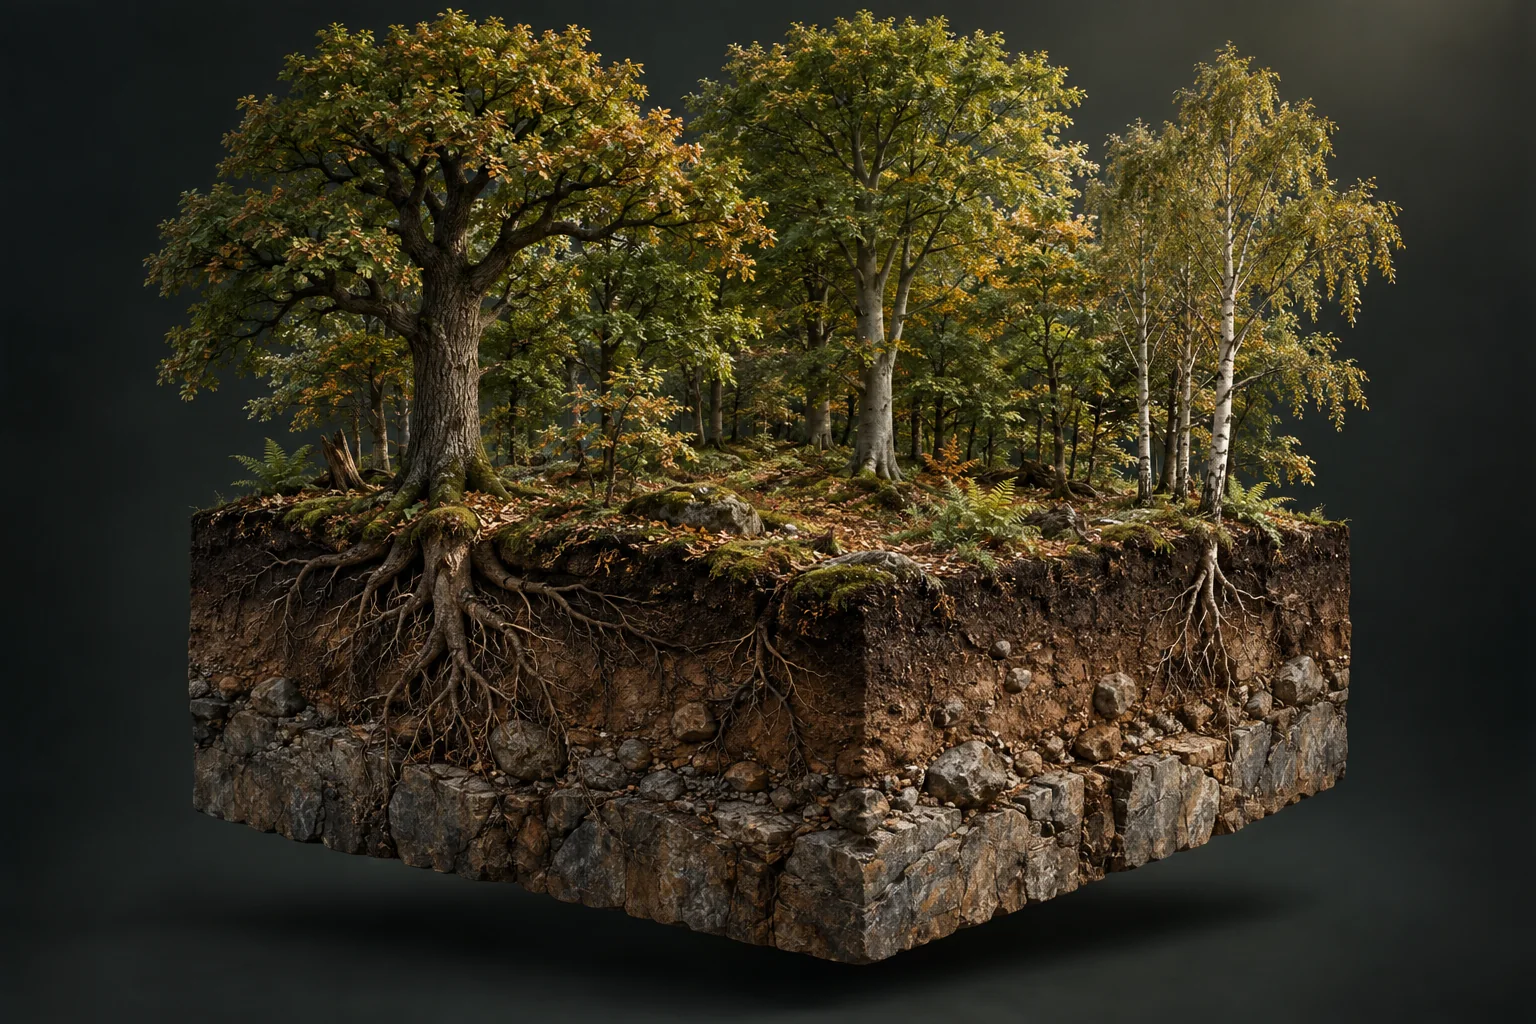
Species, ages and stand structure change how woodland is assessed. A visit helps compare hypotheses with the trees actually present.
Explanatory illustration · not a depiction of an analysed propertyFrom a benchmark to a property
Legal and practical access, slopes, fragmentation and stand condition need examination. An asking price is not a completed sale. Comparable references must cover the same kind of asset and separate woodland from buildings.
Why there is no price page for every town
A useful local page needs its own substantiated data and analysis. We do not reproduce national averages across hundreds of near-identical pages. Select the French parcels you are interested in to inspect available local information.
Why older releases are not always directly comparable
Safer’s 2026 summary records a segmentation change and recalculation of the preceding ten years. Use changes published within the same edition rather than calculating growth between different releases. Source: Safer 2026 summary, page 4.
Sources and dates
- Safer — 2025 forest market, published 21 May 2026
- CNPF — Buying and selling woodland, updated August 2025
- IGN / DGFiP — API Carto
- IGN — BD ORTHO
- CNPF — Timber sales
Accessed 29 September 2026. Independent sources; no partnership implied.